What's your best-selling product this week?
If you struggle to answer, Analytics is for you. Sales, average ticket, top products and hourly peaks. POS data, in real time, no spreadsheets.
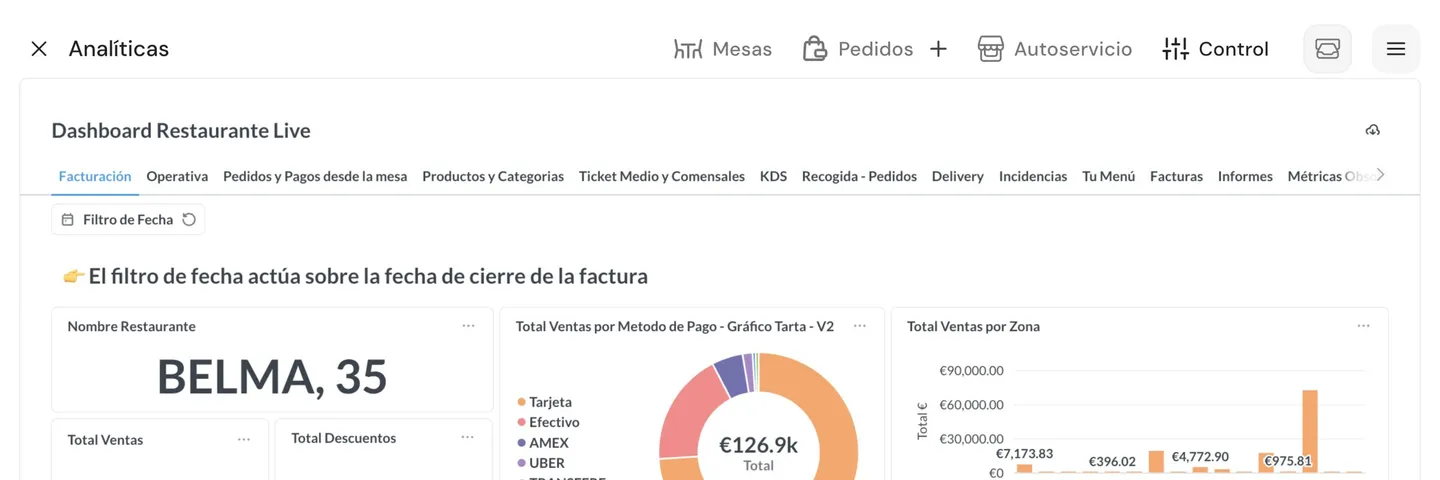
The data is already inside your POS.
Every sale, every order, every payment goes through Qamarero. Analytics puts it all on one screen with filters and comparisons. No copying to spreadsheets, no maintaining external dashboards.
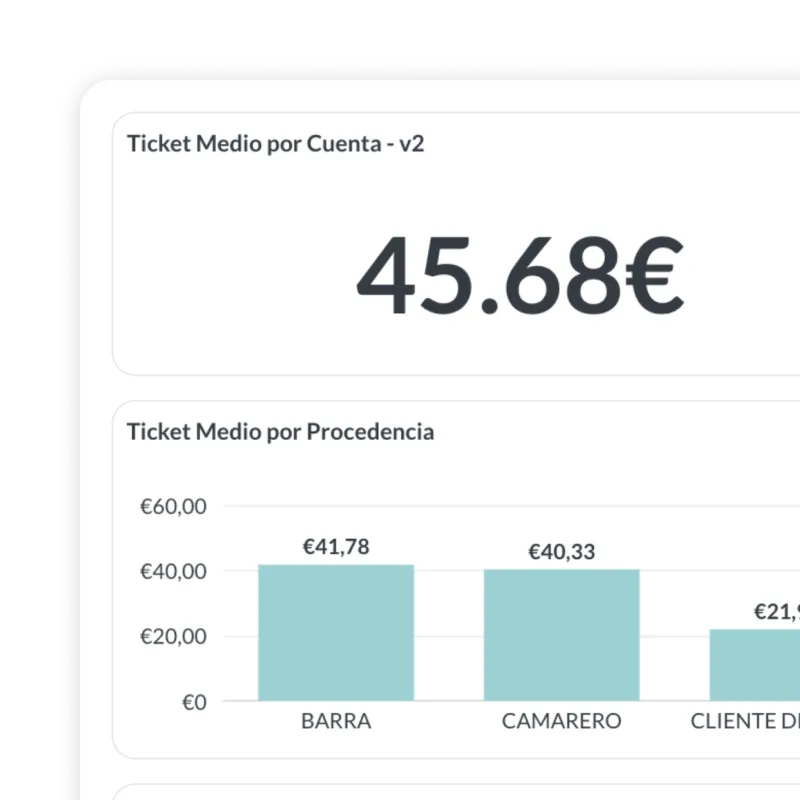
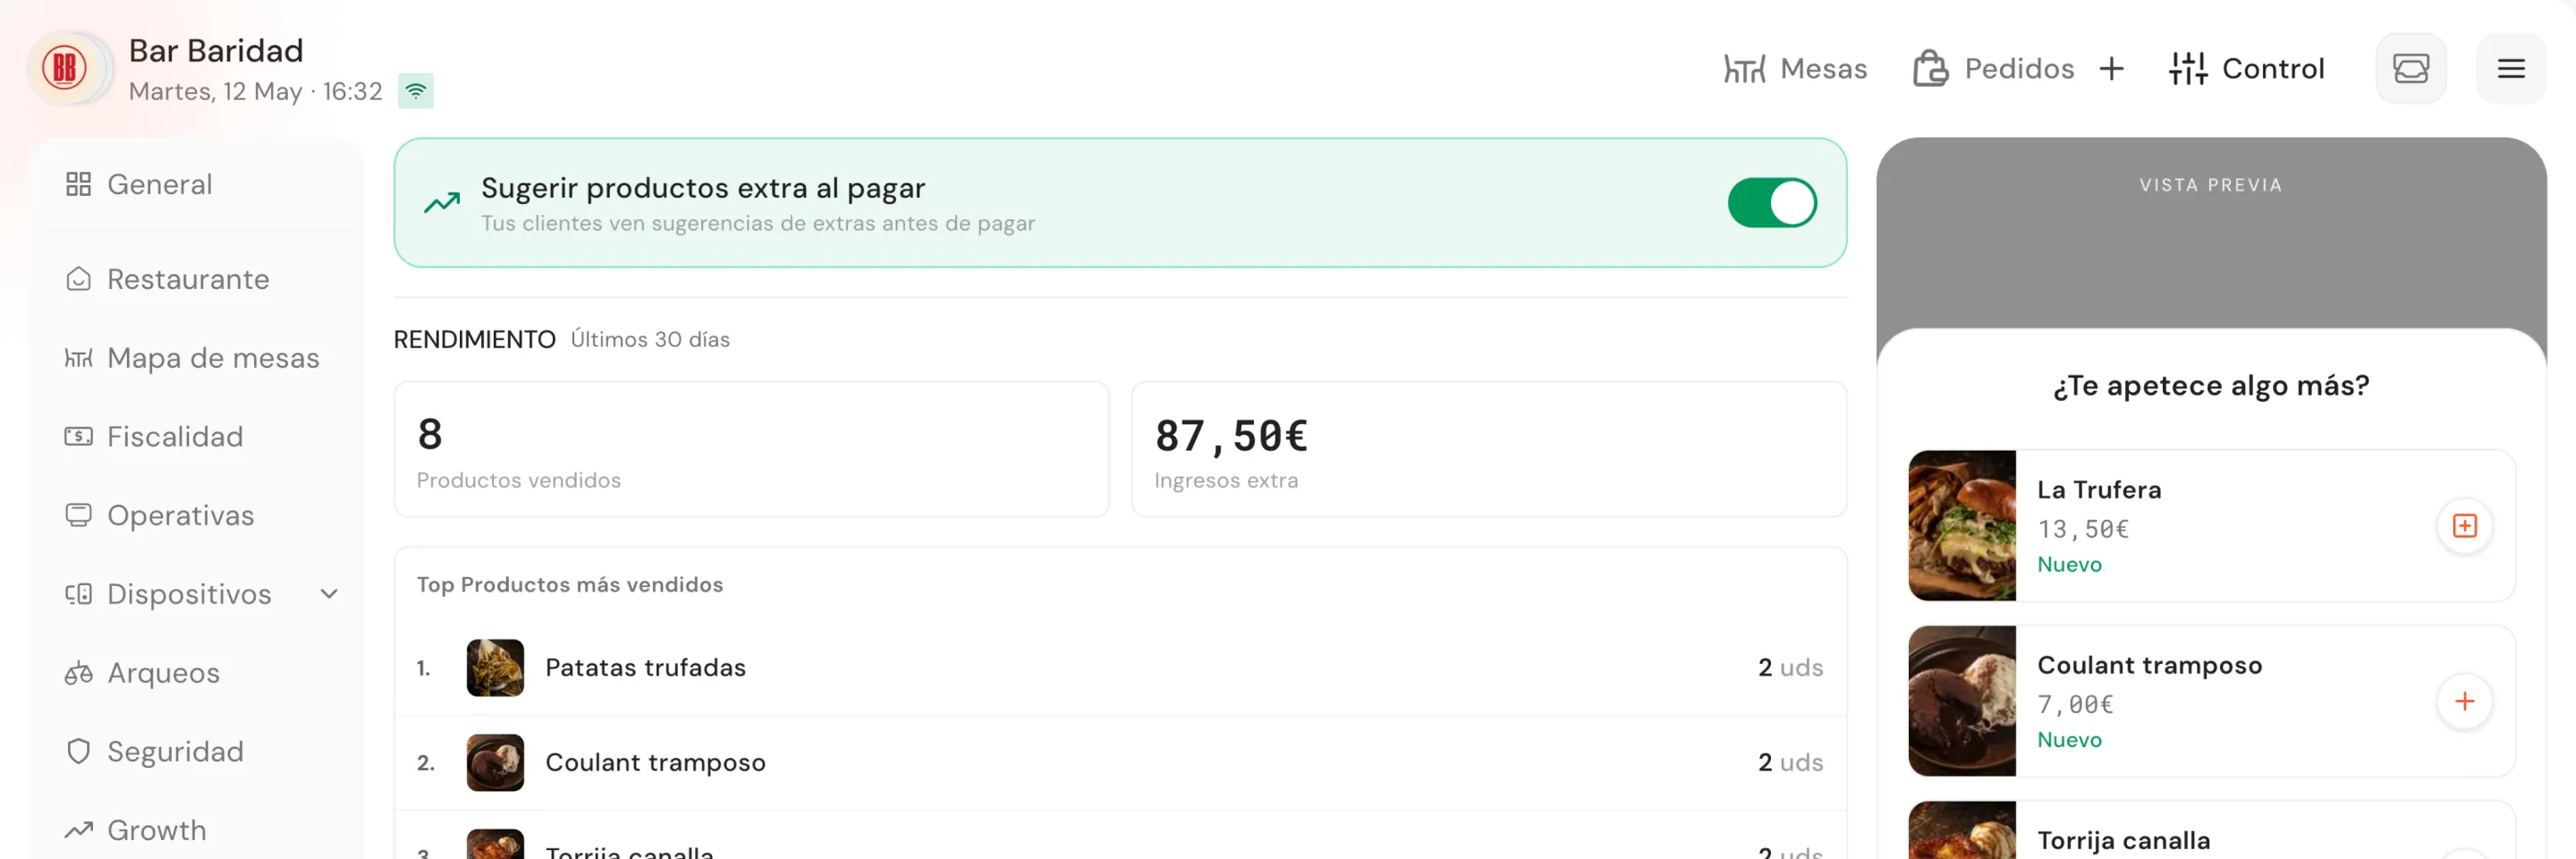
Real-time sales
Daily total, orders, average ticket. Hourly breakdown to spot peaks. No waiting for end-of-day cash close.
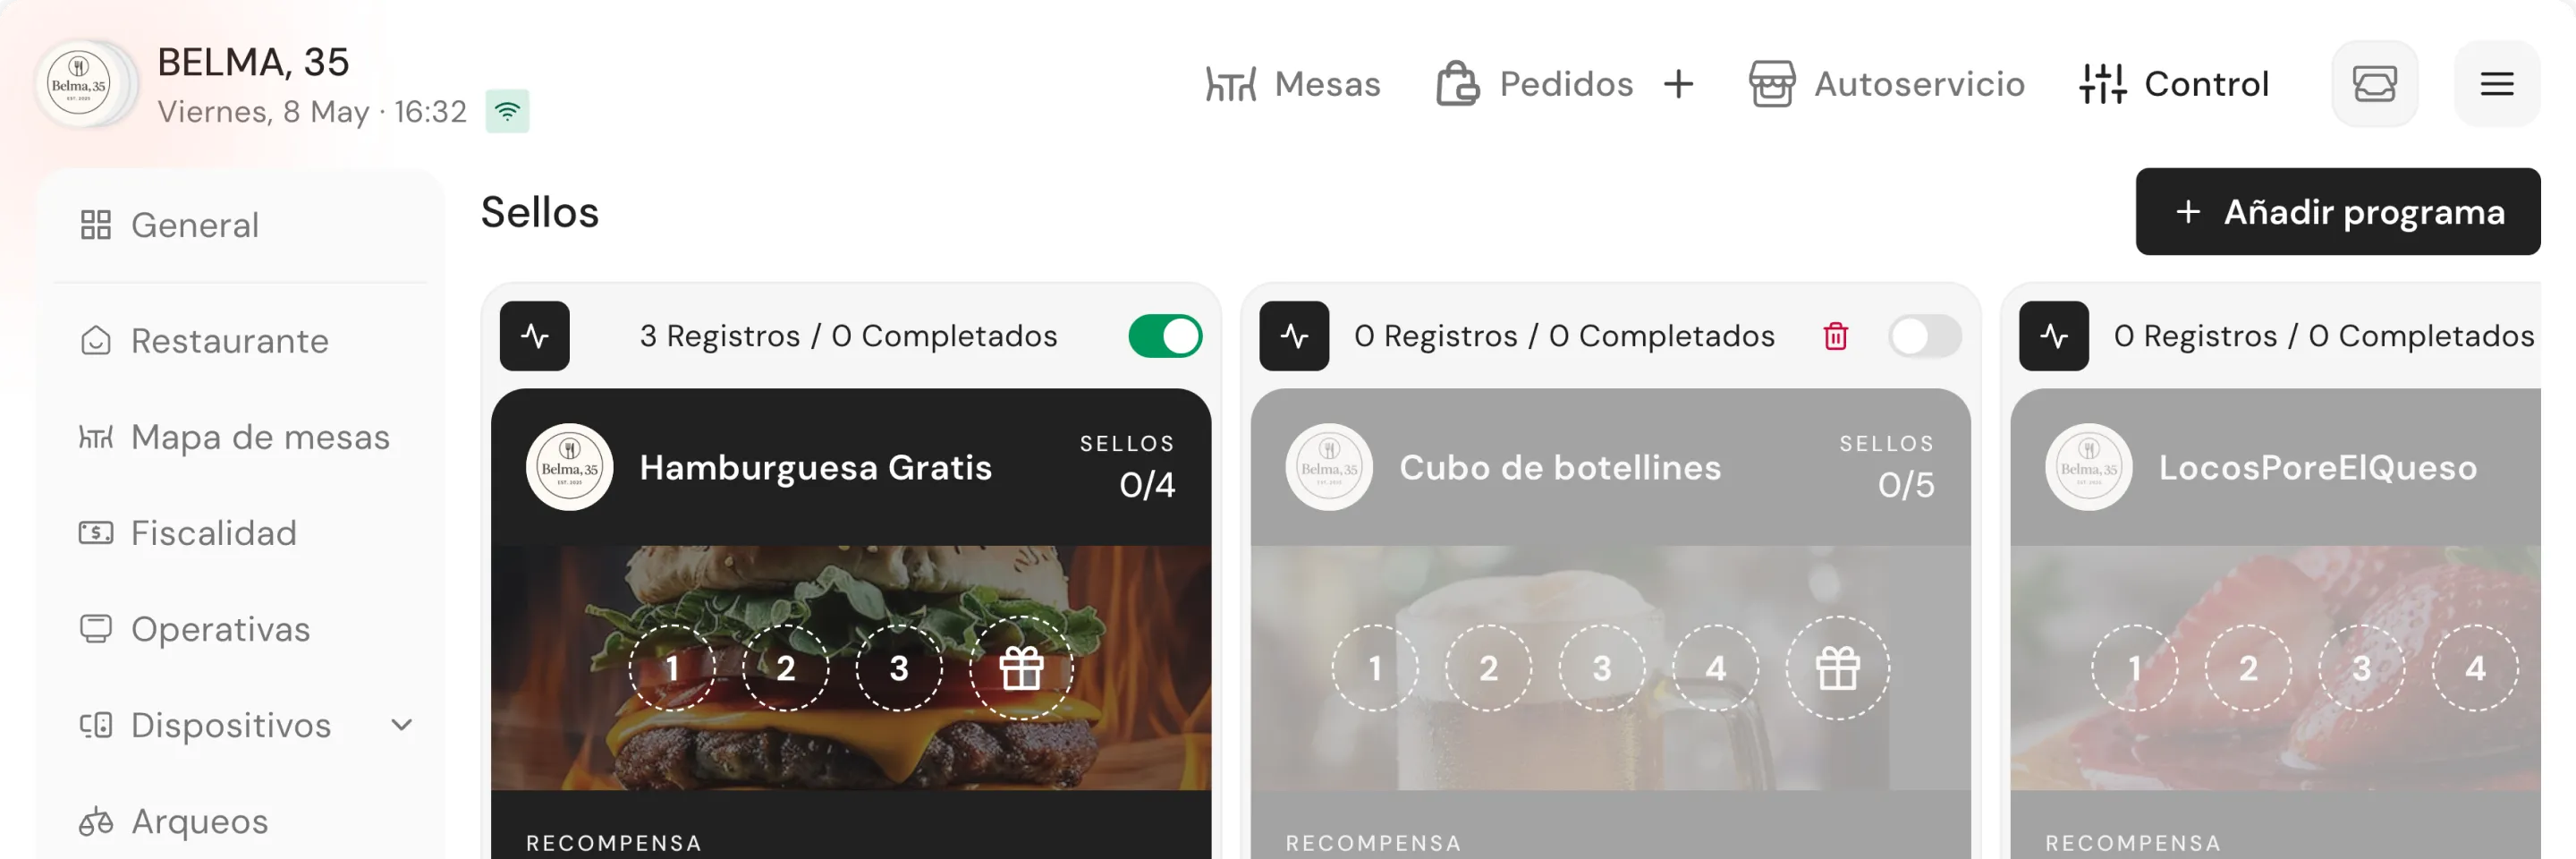
Top products and the ones that don't sell
Ranking by product and category. See what sells, what doesn't, and what menu decisions to make.
Period comparisons
This week vs last week. This month vs last month. An arrow up or down — enough to know how you're doing.
Want to see it with your data?
15 minutes, no strings attached.
From cash close to menu decisions.
Sales dashboard
Total revenue, number of orders, average ticket. Hourly and daily breakdown. Included in the Basic plan.
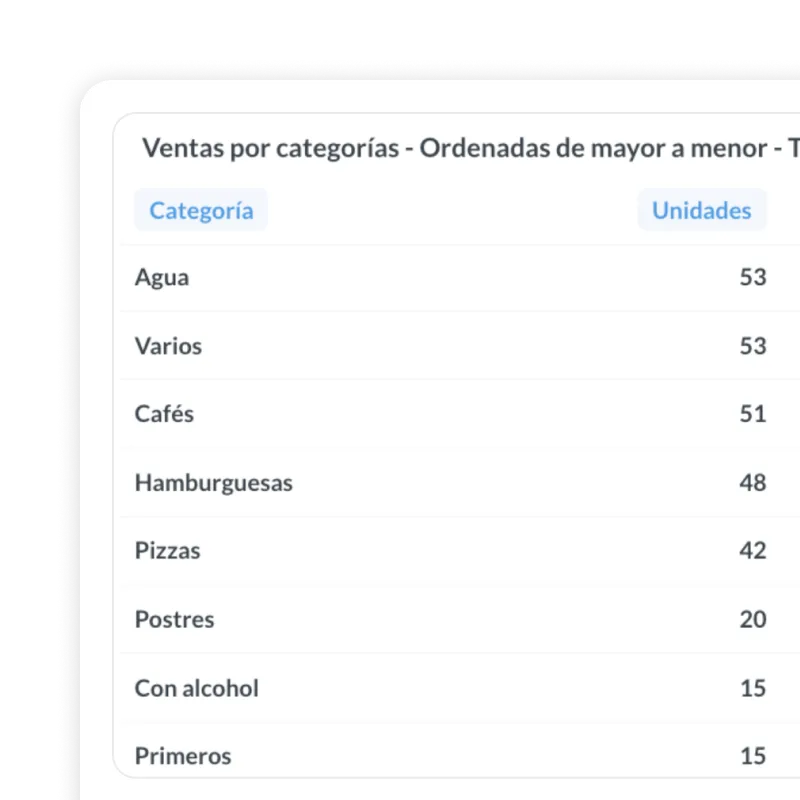
Products and categories
Ranking of best sellers. List of items that don't move. Filter by category (starters, mains, desserts, drinks).
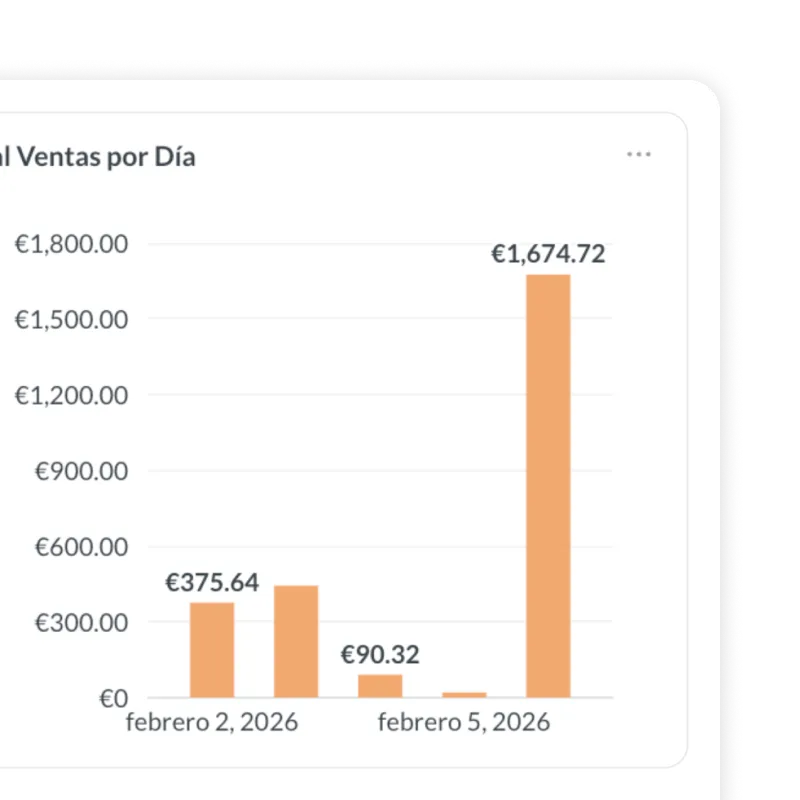
Peak hours
Sales by hour and day of the week. Useful for deciding how many shifts to cover and when.
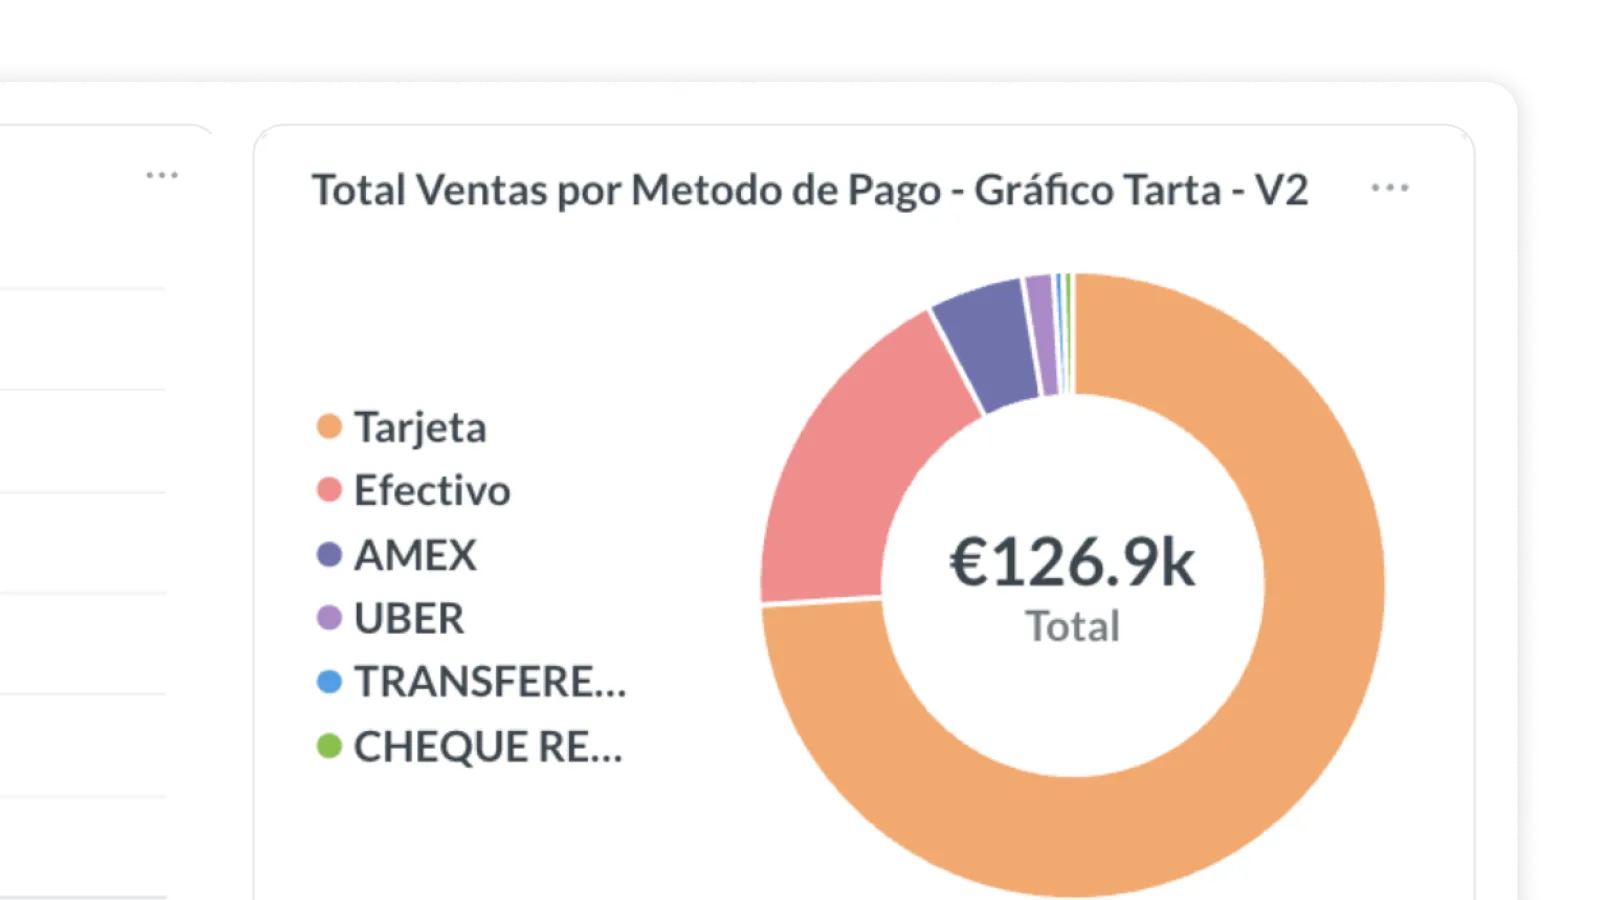
Payment methods
Breakdown across cash, card and other methods. If something shifts, you catch it before it becomes a problem.
Customers and loyalty
New vs returning, average ticket per segment. Available on Growth and Total plans.
Costs and inventory
Cross-reference sales with stock to track turnover and waste. Available on Control and Total plans.
Included from 119€/month.
Sales dashboard on all plans. CRM, bookings and loyalty on Growth. Costs and inventory on Control.
Frequently asked questions
Do all plans include analytics?
Yes. From Basic you get a sales dashboard, top products, sales by hour and day, and payment methods.
What else does Analytics offer on advanced plans?
Growth adds CRM, bookings and loyalty metrics. Control adds costs and inventory. Total adds custom dashboards, advanced comparisons and data export.
Can I see products that aren't selling?
Yes. In Analytics → Products and Categories you see both best sellers and items that haven't sold in the selected period.
Isn't this the same as looking at cash close reports?
Cash close tells you how much you collected today. Analytics tells you why, when, which products and how it compares to yesterday. One is the data, the other is understanding the business.
Can I export to Excel?
Basic export is available. Advanced export with custom formats is in development.
What if I already use Metabase or another tool?
Analytics lives inside Qamarero. No queries to set up, no dashboards to maintain — the data flows automatically from the POS.
Can I compare sales between two months?
Yes. You can navigate between periods and compare. Advanced comparisons (same month previous year, benchmarking) are in development.
Where do I find it?
From the POS panel → Management → Analytics. There are also dedicated sections for products and categories.
Want to see it with your data?
15 minutes, no strings attached.